Vallenato
An interactive/static data visualization generation system
D3.js, billboard.js, Express.js, webpack, Node, CircleCI, Netlify
Initially, the Product & Design team at the Council on Foreign Relations did not have a cohesive system for producing interactive and static graphics. Data visualizations commonly lacked shared or re-usable CSS rules. It also did not have a way to consistently publish them on cfr.org or its various microsites. I created Vallenato to solve this problem. Vallenato allows the designers and developers to quickly generate graphics for the web, and lets them focus more on simply inserting data and creating great experiences while letting the system handle styleguide enforcement across all projects.
By running a command-line script and entering project-specific information like title and chart type, any user can locally initialize and render basic line charts, area charts, bar graphs, and more, complete with placeholder data, in their browser, in no time. I leverage billboard.js, a re-usable charting interface for D3.js, to accomplish this. Express.js watches and recompiles the project as it detects changes to the source files. This means that graphics are ready to view on local environments in mere minutes or faster, depending on the size of the project. When ready for production on CFR, pull requests on GitHub are then captured by CircleCI, which builds out selected projects and publishes it on the web, letting my team know via Slack when builds are successful or when there are issues. Outside of CFR, Vallenato uses Netlify, a popular hosting and serverless backend service.
For the power-users on my team, Vallenato supports bespoke interactives. Users can simply select Custom project when running the command-line script and the system generates a project folder complete with the bare-yet-prefilled necessities: a .js entry point, an .html file to see their work locally, and a custom stylesheet for any alterations on top of the common styles that all projects pull from. From there, users can install whatever project-specific dependency they require to complete the graphic. I recently built a tracker (best viewed on desktop) that combines maps and charts in one project using this method.
Graphic designers can leverage a built-in Adobe Illustrator-to-HTML utility script to turn specially-crafted static .ai files into responsive SVGs for the web. This utility has been invaluable for the CFR Digital Editorial team, as they must often rapidly respond to news topics with explanatory infographics.
Supported:
- Project-level dependencies
- Image and SVG inlining
- ai2html
- Custom projects for interactives that require more or less than the default billboard/D3 configuration
- Tailwind
- Shared resources (CSS, JS, images, data)
- On CFR: Slack integration (for communicating deployment statuses)
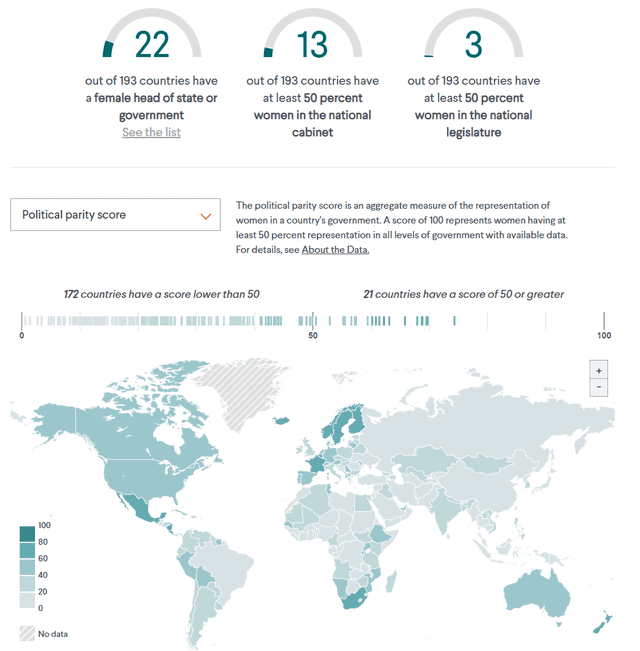
Below is a screenshot example of an interactive, the Women's Power Index, which was built on Vallenato by data visualization designers at CFR. Check it out here.
